Imaging and spectral analysis of human face and palm using hyperspectral imaging technology
Hyperspectral imaging technology is a new type of imaging data technology that has emerged in the past decade. Initially, it was mainly used in military and remote sensing detection and other fields. Now it is constantly expanding in many civilian fields, covering materials science, geophysics, environmental disaster reduction, vegetation species, crops and food, and biomedicine. In the medical field, this technology involves disease diagnosis, biomedical research and basic research, and there are also preliminary explorations in traditional Chinese medicine research, such as traditional Chinese medicine syndrome differentiation and tongue diagnosis. However, since the application of hyperspectral imaging technology in the medical field is still in its infancy, the research on normal values of the human body is still blank. This paper aims to display and analyze important parts of the human body by applying this technology, and provide normal physiological data for hyperspectral imaging human body research, disease diagnosis, and traditional Chinese medicine face and hand diagnosis. The image display of hyperspectral imaging and the spectral analysis of the face and hand parts of the human body are performed, and the results are as follows.
Materials and Methods
Subjects and experimental groups: There are 10 subjects in this study, including 5 females and 5 males, aged between 25 and 55 years old, with an average age of 33.1 years old. Hyperspectral images of their faces and palms were collected.
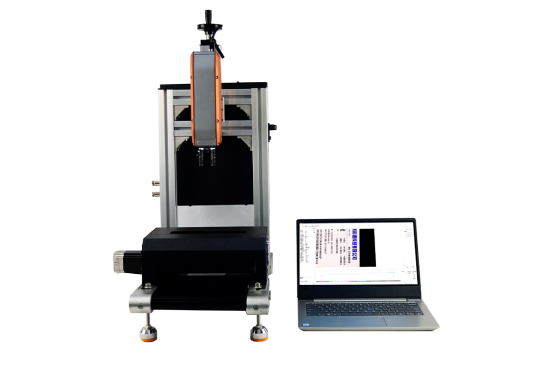
This study applied a 400-1000nm hyperspectral camera, and the FS13 product of CHNSpec Technology Co., Ltd. can be used for related research. The spectral range is 400-1000nm, the wavelength resolution is better than 2.5nm, and up to 1200 spectral channels. The acquisition speed can reach 128FPS in the full spectrum, and the highest after band selection is 3300Hz (supporting multi-region band selection).
Spectral analysis
1. Intuitive analysis of hyperspectral images
(1) Face
① Characteristics of facial hyperspectral images: Facial hyperspectral images can show the full facial contour, and organs such as the mouth, nose, eyes, and eyebrows are clearly identifiable, but ears and hair are difficult to distinguish. The face is basically symmetrical on both sides, and the shapes and sizes of organs on both sides are roughly the same. The high-reflective areas of the face are mainly in the cheekbones, cheeks, forehead, and nose bridge, while the low-reflective areas are the eyes, eyebrows, and lips. Unlike visible light images, hyperspectral images cannot show a person's appearance. ② Characteristics of facial images in different spectral bands: In the images recorded in the 450-900nm spectral bands, the facial contours are visible, and the images in the 580-830nm band are clearer. Below 530nm, the image reflection intensity weakens, each part tends to be uniform, the image becomes blurred and the noise increases, and below 500nm, the background noise gradually increases; above 830nm, the image is weakened in the original high-reflection parts, and each part also tends to be uniform, and unlike below 530nm, the noise on the image does not increase.

(2) Palm
① Characteristics of overall light intensity distribution of the palm: The palm hyperspectral image covers the entire palm contour, and can distinguish various parts and fingers. The finger, hypothenar, and palm fingerprints are clearly visible. The palm is basically symmetrical on both sides, but there are differences between different parts and individuals. The highly reflective parts of the palm are the finger mounds and hypothenar parts of the four fingers, and the reflection at the ends of the five fingers is weak. The shape of the palm can be seen through the hyperspectral image.
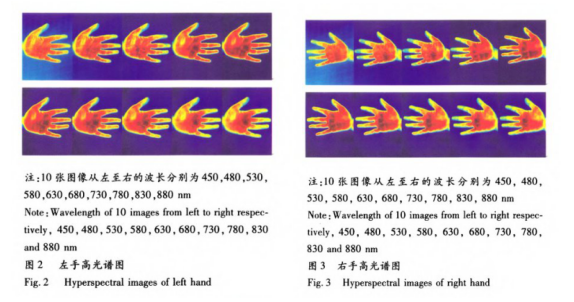
② Characteristics of facial images in different spectral bands: Similar to facial hyperspectral images, in the images recorded in the 450-900nm spectral bands, the outline of the palm is fully visible, and the images in the 580-830nm band are clearer. Below 530nm, the reflection intensity of the image is weakened, each part tends to be uniform, the image becomes blurred and the clutter increases, and the background noise below 500nm gradually increases; above 830nm, the image is weakened in the parts with strong high reflection, each part also tends to be uniform, and the clutter does not increase.

2. Analysis of the reflected light intensity of different detection wavelength bands on the face and palm
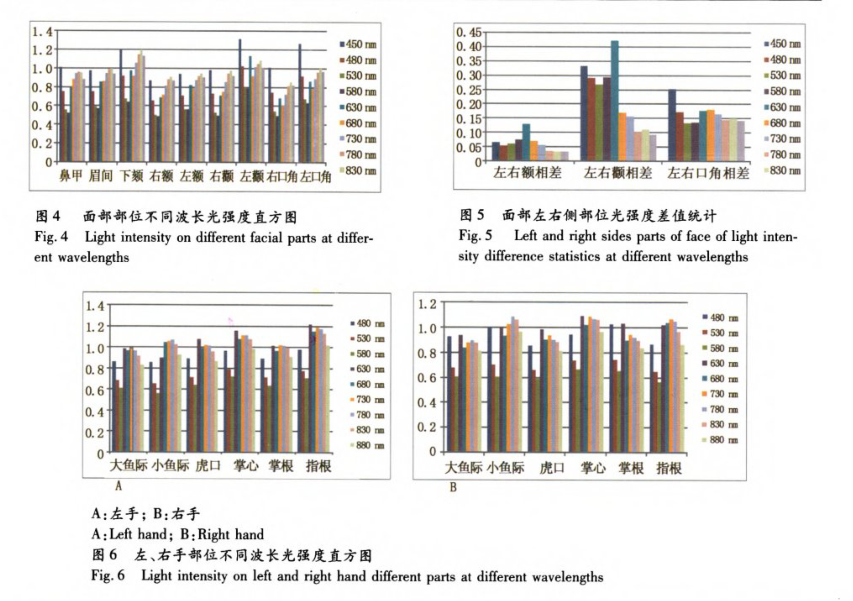
(1) Face: The statistical analysis of the mean light intensity of each part of the face shows that no matter which part of the face, the light intensity value is higher in the 450nm and 730-880nm regions, and lower in the 530 and 580nm regions. From the analysis of the parts, the light intensity value of the lower forehead is slightly higher, and the other parts are relatively close. The normal face has good bilateral symmetry, and the bilateral light intensity difference of most parts and organs is not large; the left and right cheekbones have a slightly larger difference in 450-630nm and the left and right corners of the mouth have a slightly larger difference in 450nm.
(2) Palm: The statistical analysis of the mean light intensity of each part of the palm at different wavelengths shows that the results are similar to the facial hyperspectral image, with higher light intensity values in the 450nm and 730-880nm regions and lower light intensity values in the 530 and 580nm regions. The light intensity of each part of the palm is counted by subtracting the right hand from the left hand. It can be seen that the light intensity values are close in each part of the palm. The difference between the two sides of the finger base is slightly larger in different light wave bands.
3. Spectral distribution characteristics of different detection wavelength bands of face and palm
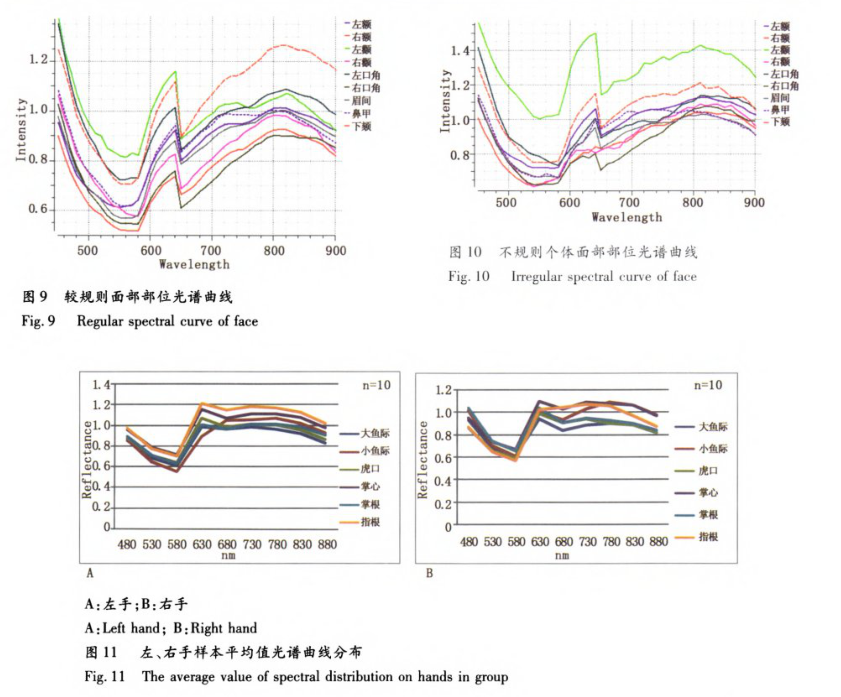
(1) Characteristics of facial spectral distribution: Through PhySpec1.9.2 hyperspectral control and analysis software, it is observed that the spectral curves of facial parts are similar, the light intensity in the 500-580nm band is low, and the reflection intensity of different parts is different. Details of the sudden change of light intensity at one or some wavelengths can be seen in the spectral curves of each part. The average spectral curve of the sample mean reflects the group characteristics, while the spectral curves of different individuals are quite different from the group and typical individual curves in some spectral bands.
(2) Characteristics of palm spectral distribution: Physpec1.9.2 hyperspectral control and analysis software is used to observe that the spectral curves on the left and right sides of the palm are similar. As with the face, the light intensity in the 500-580nm band is low, and the reflected light intensity varies from part to part. Details of the sudden changes in light intensity at certain wavelengths can be seen on each spectral curve. The average spectral curve of the sample mean reflects the group characteristics, and the spectral curves of different individuals differ greatly from the group and typical individual curves in certain spectral bands.
III. Conclusion
1. Hyperspectral images can clearly show different parts of facial organs and palms, among which the 580-830nm segment is clearer. The reflection intensity of different parts of the face and palms is inconsistent, and the spectrum is basically symmetrical on both sides, and the characteristics of the parts can be shown on the spectrum curve.
2. Hyperspectral imaging technology can clearly show the spectral distribution characteristics of the human body surface. The spectral distribution law of normal people will provide a reference for disease diagnosis and TCM syndrome differentiation.


